The Invisible Metric
Tom Farrow

“It ain’t what you don’t know that gets you into trouble. It’s what you know for sure that just ain’t so.”
Mark Twain
‘Metrics’ have become increasingly utilised throughout sport and have become synonymous with the concept of sport science. A metric is generally a figure utilised for measuring something. In modern sport science, when we speak about metrics, we’re often referring to GPS variables such as ‘Total Distance’ (the total amount of distance covered within a game or training session), ‘High Speed Metres’ (the amount of distance covered above a certain threshold, most commonly in 5.5m/s within male field sports) and ‘Accels/Decels’ (a count of how many times an athlete has gone above a certain threshold, usually +3m/s/s for accelerations and -3m/s/s decelerations), amongst others.
These numbers have become the foundation of how training sessions are planned within professional team sports, they’re key performance indicators within rehabilitation processes and they’re one of the ways that performance & medical departments forensically review non-contact injuries to understand if a change in the player’s ‘load’ may have contributed to the injury occurring. They have been significant for us as practitioners (performance coaches, rehabilitation specialists, physiotherapists etc) in being able to progress our processes in all areas of our work.
But there’s a problem… Despite the increase in the metrics that surround our practice as sport scientists / coaches, the significance of injuries is increasing. Where injury rates have maintained stable (as they generally did in the Premier League between the 20/21 and 23/24 seasons), Injury Severity has considerably increased.
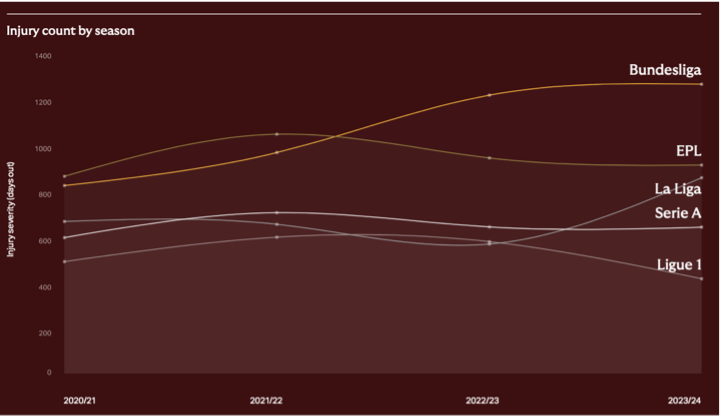
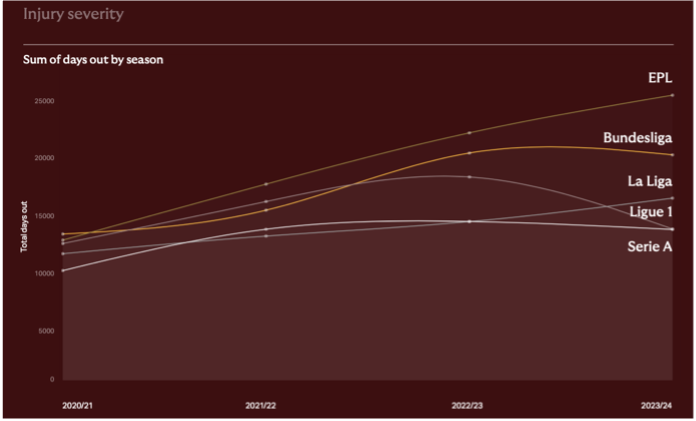
Figure 1a & 1b: Injury Count & Injury Severity by Season Across the 5 Major European Football Leagues. Source: Howden’s Insurance – Men’s European Football Injury Index
Injury Severity is an interesting measure; it’s a measure of how long it takes for a player to return from injury. In the case of the above data, this is from the first match they miss to the first match they return to the match day squad. One way you could interpret its increase is that the injuries that players are sustaining are getting worse – more traumatic and with a greater degree of tissue damage.
That may be the case… But there’s another way you may interpret that data. Maybe clubs are taking longer to return players from injury?
This may be a surprise given the significant increase in investment that clubs have made in their performance & medical departments (for clarity; performance & medical departments are generally compiled of doctors, physiotherapists, strength & conditioning/performance coaches, rehab specialists, sport scientists, nutritionists & psychologists, amongst other associated disciplines).
With more money being invested into departments; more staff, more technology, along with more say on the overall training and rehabilitation process, why wouldn’t we have seen an improvement in this data?
Despite the progress made in staffing and technology, ‘setbacks’ within the rehabilitation of athletes in professional sport environments are still common. These exist across clubs and even across sports. While the occasional setback would be expected, the frequency with which they’re occurring, considering the increase in funding within this area, suggests part of the process is misfiring somewhere.
One way we can try to understand what’s happening is to home in on where in the process these issues tend to occur. Most frequently, setbacks happen around the period that a player returns to pitch-based sessions, or when they transition from individual pitch-based sessions to team-based sessions and games. It is much less common for issues to occur early in the rehabilitation process.
While there could probably be an entire book written on this phase of rehabilitation, and maybe I will follow up this article with more in the future focused on this area, I would like to introduce an idea here that may be of use. This idea is something I consider within all the rehabilitations I have undertaken.
This isn’t an idea based in science per se. It’s a heuristic – an aid in decision making, that has helped stop me from making unnecessary mistakes (PS. Aiming to not make unnecessary mistakes is a great primary focus of any rehabilitation process…) Nassim Taleb explains heuristics as “simplified rules of thumb that make things simple and easy to implement. But their main advantage is that the user knows that they are not perfect, just expedient, and is therefore less fooled by their powers. They become dangerous when we forget that.”
As you may have guessed from the title of the article, the idea I’m referring to is the Invisible Metric.
The way I employ the Invisible Metric is, at any significant phase change, imagine that there is a metric spiking/increasing significantly, even though you can’t see what that metric is. Then respond to that increase as you might do to a significant increase in a metric you can see. This appreciates the difference between what our dashboard says happened and what the athlete’s system experienced when we go from gym to pitch, from individual sessions to team sessions, and from team sessions to matches.
The idea of the Invisible Metric respects the fact that, despite the wealth of data available to us, we still have a very limited insight into what is occurring at the system or tissue level with regards to the body. The body is far more complex than we are able to fully appreciate and its response to novel stimuli is impacted by a myriad of factors that we can only partly understand.
Most practitioners have experienced this at some point in their career. For example:
- The player had a successful gym phase within rehab; hitting strength-based KPIs comfortably, but picks up a low-grade injury within the first couple of weeks of returning to the pitch.
- The player progresses smoothly through individual pitch sessions but breaks down within a week or two of returning to team sessions, despite the numbers all seeming to be ‘in range’.
- Or the player gets through team training, then picks up a soft tissue injury in their first significant match return.
The mistake is not that we used GPS metrics. The mistake is that we treated those metrics as if they described the full experience of the session.
The moment you move up a level, the context changes. The GPS may tell you the external work matched the target. The idea of the Invisible Metric reminds you that the internal price may not.
Recent articles from Martin Buchheit (here) and Tim Gabbett (here) have focused on the limitations of GPS in informing our understanding of what is occurring at a system and tissue level. However, within professional organisations there is sometimes little room and little time for nuanced conversation on the nature of individualised responses to stimuli (or ‘load’). As with all large organisations, there is often pressure from above to demonstrate clear protocols that can be universally followed, so it is apparent where in a process things break down. But sometimes it is the universal protocol that is the problem… (another issue for another article).
Within rehabilitation, when we progress through phases, a number of variables change, although we can’t currently track the magnitude of these changes. Some examples:
Intent: Players will run harder, brake later, and be more creative with their movement strategies as drills become more externally focused (eg. Responding to a ball/other player/coach) vs the more internal focus of gym-based exercises.
Arousal: When players return to games a key factor that we can’t account for is the increase in arousal compared to training sessions. Especially if the player is returning from a long time on the sidelines. We can’t necessarily quantify how this increase in arousal may affect firing rates or motor unit recruitment, but we can assume it likely does and therefore assume greater demands on the system and tissues.
Novel Movements: these reactive decisions result in shapes, foot placements, angles and less predictable tissue loading, all of which the players may not have been exposed to for a number of weeks/months.
Loss of control over dosage: In the later stages (when the player is transitioning from individual pitch sessions to team sessions, or from team sessions to matches), rest periods, density, intensity, spacing, and complexity are no longer choreographed by the coaches. At this stage we’re relying on our rehab process to have prepared them for the novel chaos these situations present. Often missed in this, is how we respond to that novel chaos… Now the player is ‘back fit’, are we assuming they fall in with the schedule of the wider team, or are we still allowing windows of adaptation to these novel stimuli? The ‘dosage’ referred to here is maybe the most significant aspect of this article and where the idea of the Invisible Metric has most utility.
Threat perception: after injury, the nervous system often treats certain positions, speeds, and decelerations as unsafe, especially if the progression to these positions/speeds has been accelerated. If there are underlying compensation strategies that haven’t been addressed within the rehab phase, stress on supporting areas can be acerbated.
These are some of the reasons why setbacks tend to occur at transitions. Not because we are careless. Because a step-change in context can create a step-change in effective load that our visible metrics may not fully capture.
A simple rule: treat context as a load amplifier.
When the environment becomes more chaotic/complex or more meaningful to the player, assume the same external numbers represent a higher effective load.
This means keeping in mind:
- Pitch work is not just running instead of lifting/gym-based plyos.
- Key metrics within team sessions don’t necessarily mean the same as those metrics in individual sessions.
- Key metrics within matches don’t necessarily mean the same as those metrics within team sessions.
It is not that our GPS numbers are wrong, just that GPS cannot fully describe the change in meaning and decision density that changes how forces are expressed within these different contexts.
If we delve deeper into the data during these transition points, we often find certain metrics that we can track that have in fact increased (eg. Z6 decelerations when going from individual sessions to team sessions). But it is often not practical to track a large number of metrics. The Invisible Metric heuristic can mean we get a good outcome without losing ourselves in masses of data before every decision we need to make.
If we return to the injury severity trend in the graph at the start of this article, one interpretation is that the injuries are getting worse – more significant / severe. But another interpretation is that the margin for error at return-to-play has narrowed.
If that is true, as Twain said: the thing that gets us into trouble is not what we do not know. It is what we believe we know for sure. We know the GPS numbers. We know the targets. We know the protocols. But do we know where the athlete is actually at on a system/tissue level and how changes in context affect this? Utilising the Invisible Metric heuristic during these phases may save us from our certainties.